Growth analytics for healthcare campaigns
Measurement infrastructure
Reliable optimisation starts with reliable data. I coordinated with project managers and software engineers to design and implement the web analytics tracking infrastructure using Google Analytics and Google Tag Manager — so every downstream report was built on events we could actually trust.
Weekly optimisation cycle
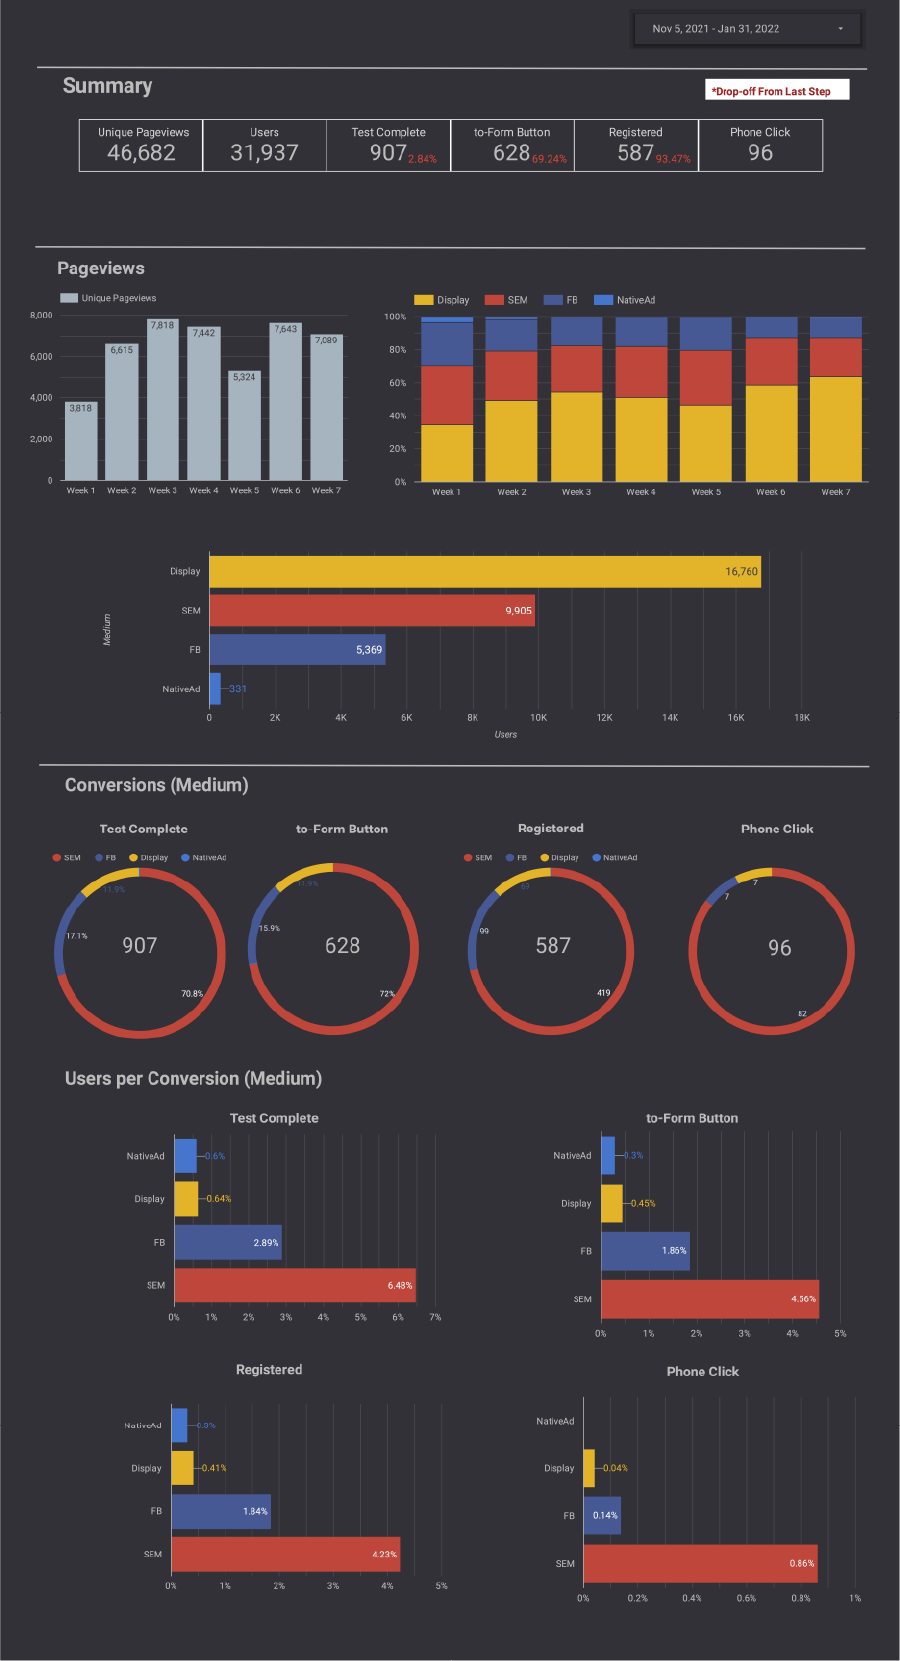
Every week, campaign performance went through in-depth analysis in Looker Studio focused on audience-segment optimisation. That cadence — analyse, recommend, reallocate — kept over 90% of weekly KPIs on target and improved conversion rates by 20%. I advised the project manager directly on ad budget allocation and on which strategies suited pharmaceutical clients' constraints.
Funnel prioritisation
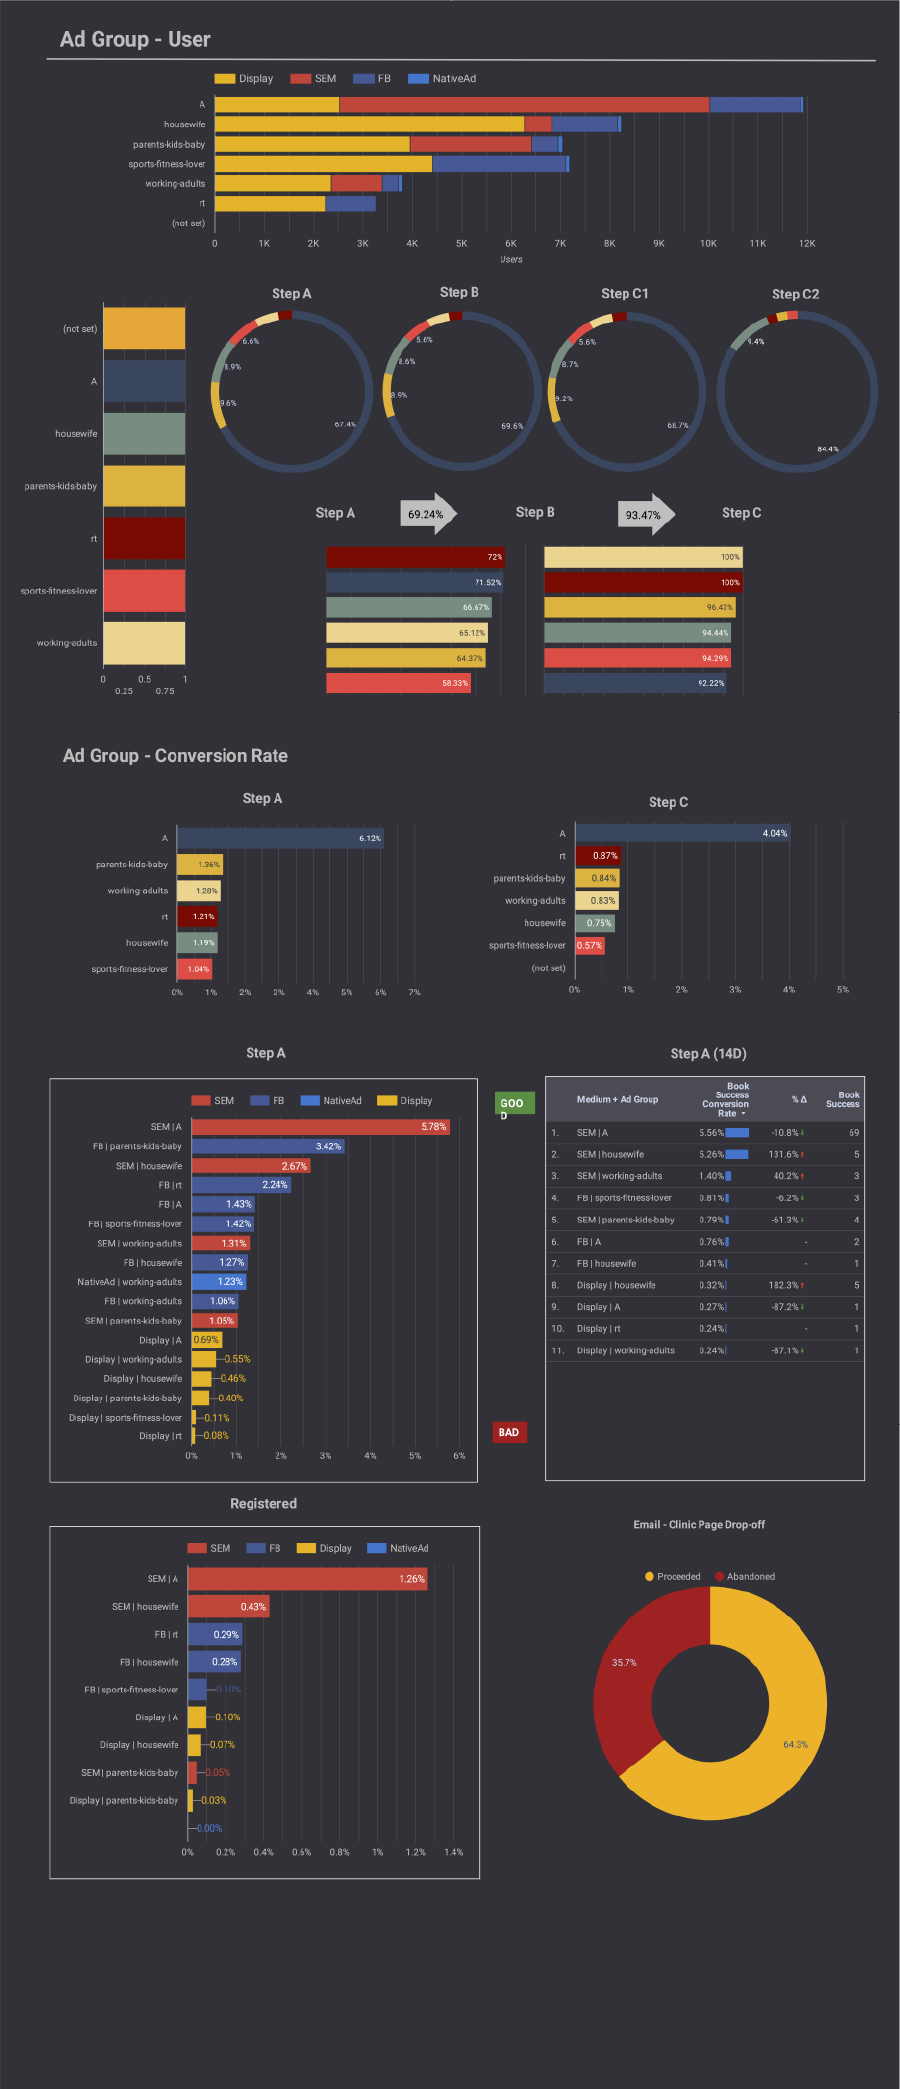
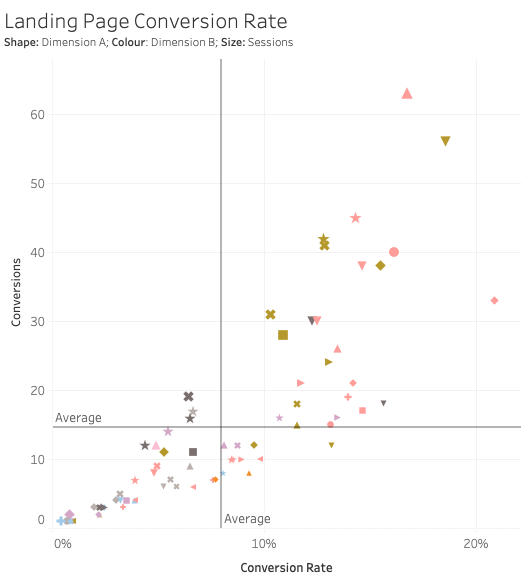
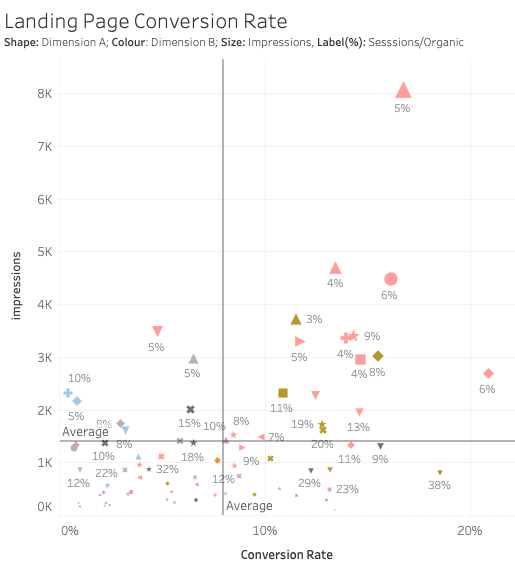
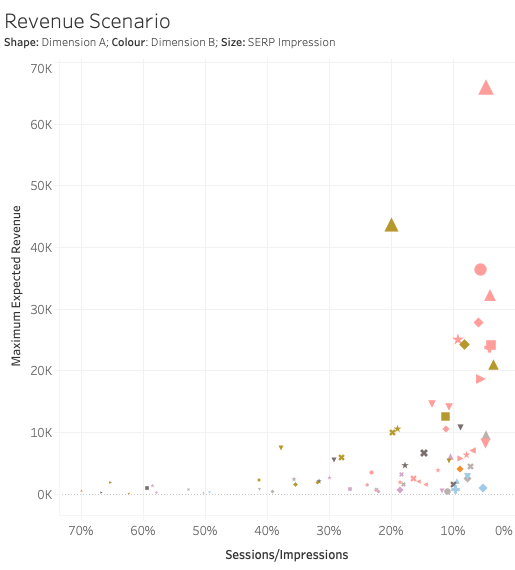
Beyond individual campaigns, I used conversion-funnel analysis to decide where effort was worth spending: picking the most efficient step at each stage of the funnel, then combining conversion rate with search-impression data to find landing pages with the highest SEM potential — not just the highest current conversion rate.
Reporting stakeholders actually read
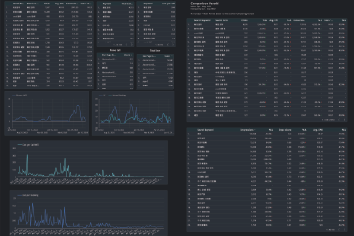
Weekly performance reports went to both the project manager and clients — visualised in Looker Studio and Tableau, designed around the decision at hand rather than the data available. For client-facing summaries I paired Tableau charts with Canva layouts.

Results
- +20% conversion rate through weekly audience-segment optimisation
- 90%+ of weekly KPIs met across 20+ campaigns for pharmaceutical clients
- Budget advisory role — recommendations on allocation and strategy acted on by PM and clients
- −30% reporting hours by automating the data pipeline (see automation case study)