Enoch Cheung
Profile
Business and analytics professional with 5+ years of experience translating digital marketing and product data into decision support through dashboards and performance analysis.
Recently completed an MSc BA (Health) with training in evidence synthesis to analyse how social and digital factors influence adoption and implementation withinin healthcare contexts.
Domain
Digital analytics in health and healthcare contexts
(Interest in prevention and primary care–oriented health solutions)
Skills
Technical: GA4 · GTM · Google Ads · SEO · Search Console · Looker Studio · Tableau
Research: Systematic literature review · Decision-analytic modelling
View My LinkedIn
Organic Traffic and Conversion Rate
Description: This illustration shows ways to pick out the best performers in different scenarios and would result in different priorities. One way to perceive conversion funnel optimisation is to pick the most efficient step at each step to maximise the outcome, for example, as simple as allocating marketing budget based on conversion rate in leads would have a better multiplying effect. Extending the concept to the whole funnel such as prioritising product optimisation for the highest revenue product or picking out higher potentials for SEM based on both conversion rate AND search impressions gives better total leverage.
1. Leads and Conversion Rate
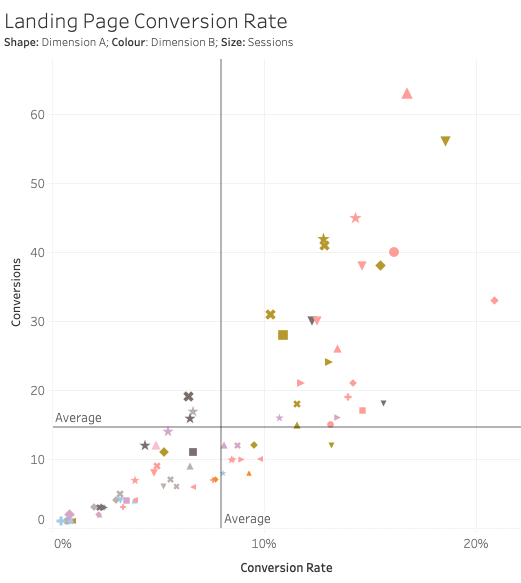
Here we try to pick out best performing landing page with the highest conversion rate and total conversions for organic traffic. The conversion rate we are using here is conversions/sessions. We see organically Dimension B in pink and brown dominates the better blocks of outcome.
Now let’s focus on the brown inverted triangle on the top-right. Say for the next step we want to pick out landing/products with the highest potential for SEM, the inverted triangle would logically be one of our top choices.
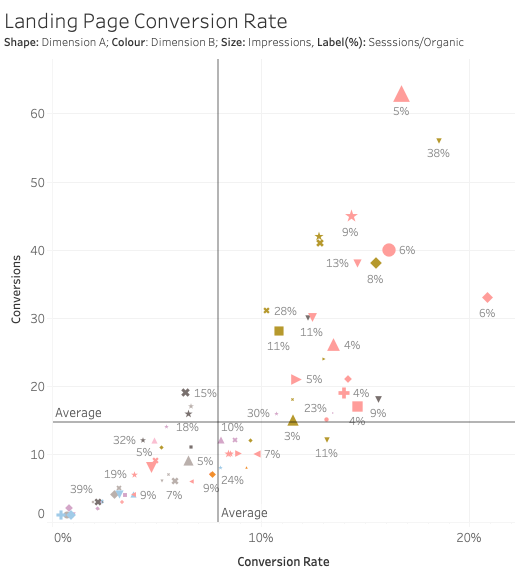 However if we add SERP data, the inverted triangle is a lot less sexy with its low search volumes and (ironically) better SEO with 38% of the maximum traffic we’ve already taken.
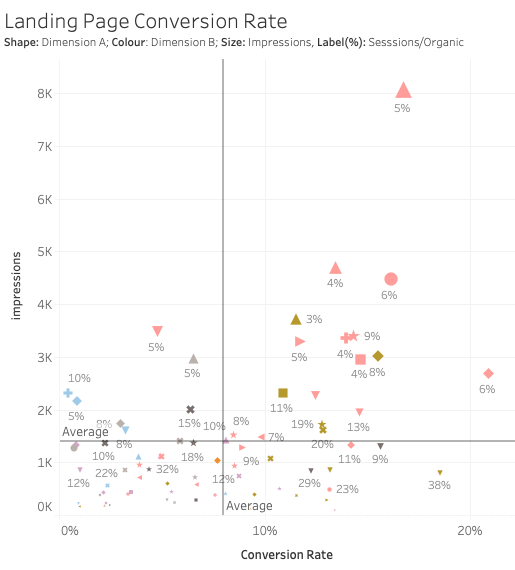 This would lead us to simply focus on impressions and conversion rate since it potentially gives a greater amount of leads. Here we see many of the landing pages in the best block (top-right) is having a low sessions-organic ratio, which is great for SEM since we want to hijack the rank in SERP.
2. Revenue Scenario
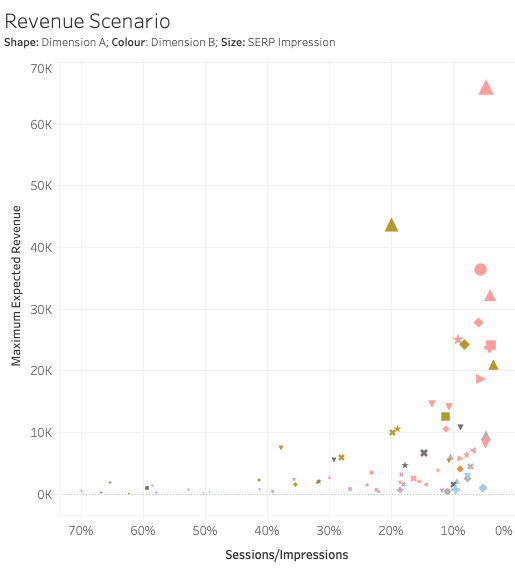 The data we use here are on leads only, but we can mimic a scenario includes the price of the product by assigning a random value to each data point. With price, we can generate a metric as maximum expected revenue with
 price * Impressions * conversion rate. This figure for sure will never be achieved as we need to work on the CTR on SERP with SEM but it should be enough at this stage.